The Ocean
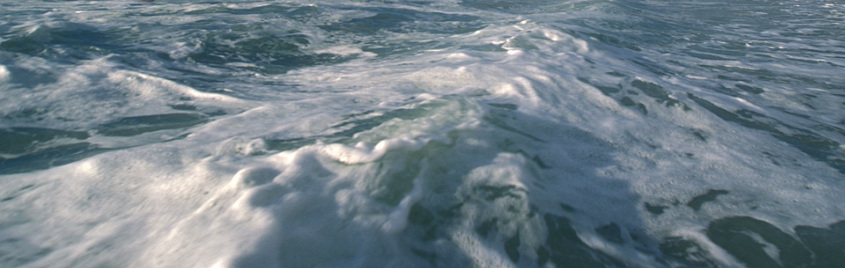
70% of our planet is covered with water. It is the habitat for 80% of all lifeforms on earth. Our oceans produce 50% of global oxygen and in exchange consume CO2 and are, with all its life such as, plankton, fishes and other animals which are vital to feed our planet and us.
Ocean Gyres' Trash
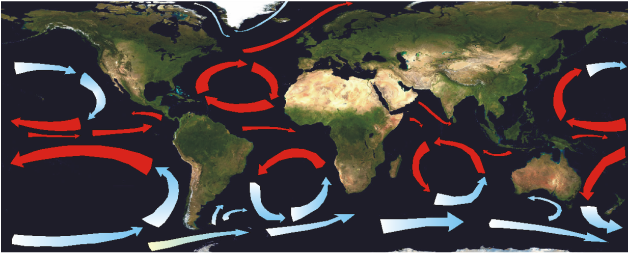
The oceans are the lowest places on earth. They are not only the habitat for so many lifeforms, they are also the final harbor for man made trash. Some of it (an estimated 15%) gets pulled out to the open water by ocean currents and is finally trapped in one of the five large ocean gyres, such as the sadly famous Great Pacific Garbage Patch.
The reality it is not quite so straight forward however, trash does not form a compact "island". The animation published by NASA in 2012 provides a better insight into how chaotically the ocean currents flow. For more details visit NASA. The term "smog" or "soup" might create the more correct picture in one's mind.
The reality it is not quite so straight forward however, trash does not form a compact "island". The animation published by NASA in 2012 provides a better insight into how chaotically the ocean currents flow. For more details visit NASA. The term "smog" or "soup" might create the more correct picture in one's mind.
|
|
|
von Land_shallow_topo_2048.jpg: NASAderivative work: Ingwik (Diskussion) (Land_shallow_topo_2048.jpg) [CC-BY-SA-3.0], via Wikimedia Commons
|
Credit: NASA/SVS
|
Marine Litter - Enough is too much
|
Even if the published numbers about the amount and dissipation of marine litter in the oceans vary drastically, there is just too much trash going into our ocean and water environment. Anja Krieger has put together two articles about the different available numbers. Take a look (01,02)! Besides the well known sources like: Algalita, NOAA, 5Gyres and SCRIBBS, I would also refer to the Master-Thesis "GARBAGE PATCH IN THE OCEANS: THE PROBLEM AND POSSIBLE SOLUTIONS" by Marzia Sesini from Columbia University. It pulls together various sources and numbers to give a concise picture. http://www.seas.columbia.edu/earth/wtert/sofos/sesini_thesis.pdf
General assumptions:
|
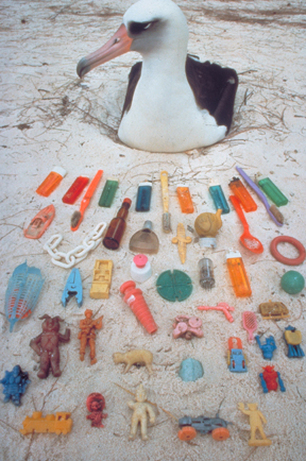
Photo credit: Ocean Conservancy
Let’s Talk Trash: The Great Pacific Garbage Patch - Perspectives on Ocean Science; Date: 1/11/2010; 50 minutes
|
Where does all the material Come from?
|
Lacking Waste Management capacity and Littering cause material emissions into the environment.
J. Jambeck et.al. have published an article in beginning of 2015 which displays the potential by country contribution of near shore population around the globe and estimate "4.8 to 12.7 million MT" to enter the ocean in 2010 which may double due to population and consumption increase until 2025 if waste management is not sufficiently in place. It was assumed that 2% of that is caused by littering. Waste Water could be a vector for litter into the water and oceans. Europe has for example a waste water directive in place. EEA has published an interactive map showing the actual implementation status. http://www.eea.europa.eu/data-and-maps/uwwtd/interactive-maps/urban-waste-water-treatment-maps Which goods were found during beach cleaning days? At the beach - "as evaluations of international garbage cleanup campaigns have shown, plastic debris from the areas of packaging and foodstuffs often enters the seas as flotsam. Among the ten most common kinds of flotsam are plastic bottles (11%), plastic bags (10%), food packaging (9%), beakers, plates and cutlery (5%)." http://www.plasticgarbageproject.org/en/themen/probleme/abfall/ more information can be found on the Ocean Conservancy Website. How much to find on the sea floor? Project Aware has released an interactive map showing what they have found over time: http://www.projectaware.org/DiveAgainstDebrisMap |
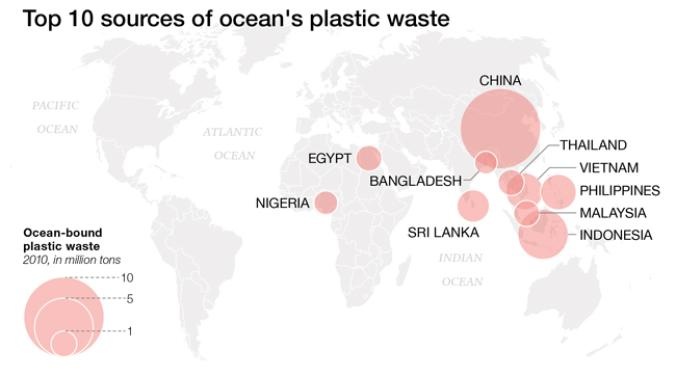
NG STAFF; J. L. WANG. SOURCE: SCIENCE, 2015
|
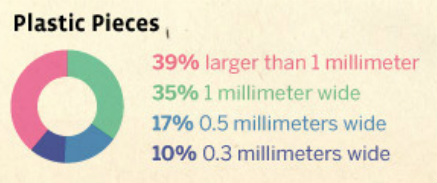
How much Material is where and which Size or Mass is there?
SAILING SEAS OF PLASTIC by Dumpark based on "Plastic Pollution in the World's Oceans..." by M. Eriksen et.al.
Dumpark has created a fascinating interactive overview about sources and locations the litter can be found: www.dumpark.com/seas-of-plastic-infographic/ .
|
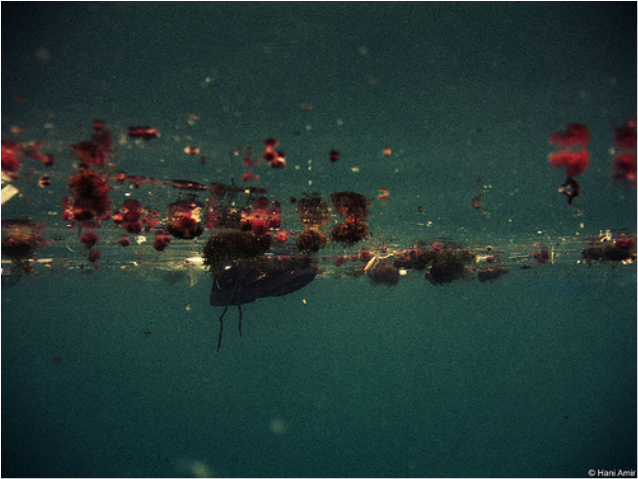
Headlines about the Garbage Island and pictures about swimming net clusters have created pictures in our mind that most of the litter to find must be large and could be pulled out of the water by big machines. Unfortunately most particles are smaller particles. That is why the litter is more often also called "The Soup".
|
What is the damage of Marine Litter
Picture by idlebrat
|

Picture by redseaexplorer.com/port-ghalib/
|
|
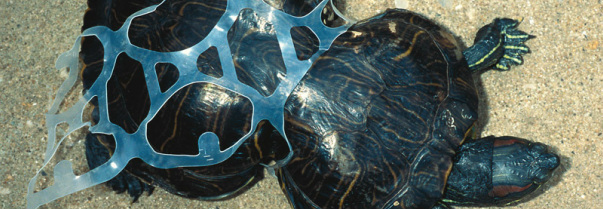
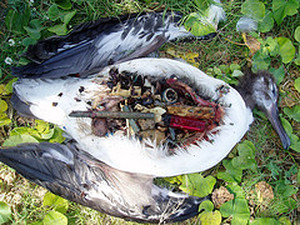
Impact on Animals:
|
|
|
Economic Impact:
Product, material and company reputation:
|
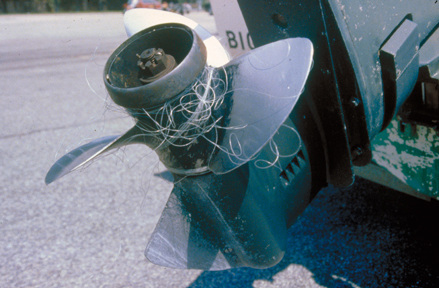
Photo credit: Ocean Conservancy
|
